
In Part 1 of this question, we explored how the correlation coefficient is calculated, and how that calculation relies heavily on the covariance between two quantitative variables. We left off with a few questions: why is r bound between -1 and 1, and why does a value of r near 0 indicate a weak association (and near an extreme indicate a strong one)? In this post, we will answer these questions!
Tag Archives: The Math of Statistics
Mathematical Musing: What is r?
A student asked me a really interesting question recently; a pair of questions, really. We have just discussed the correlation coefficient as a measure of the direction/strength of a linear association between two quantitative variables, and I demonstrated in class that the calculation for this quantity, referred to by the letter r, can be found by the formula
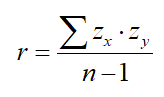
In other words, for each point of a scatterplot, find the z-score for the x-coordinate and the y-coordinate of that point and multiply those together. Do this for all of the points in your scatterplot, add them together, and divide by n-1 to get your correlation coefficient.
We discussed various properties of this quantity, and my student asked me that question that teachers always hope for (if not without a bit of dread sometimes!): “Why?” Why does this formula produce a quantity that measures the strength of a linear association? Also, why must the value of r necessarily be bound between -1 and 1? In this post, I seek to start an answer to these questions.
