
In Part 1 of this question, we explored how the correlation coefficient is calculated, and how that calculation relies heavily on the covariance between two quantitative variables. We left off with a few questions: why is r bound between -1 and 1, and why does a value of r near 0 indicate a weak association (and near an extreme indicate a strong one)? In this post, we will answer these questions!
First things first: why is r necessarily a value between 1 and -1? The math box on page 180 of your text gives an argument for this tied to r2. But here’s another argument.
Recall the alternative definition for r given in the previous post:
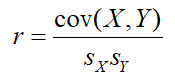
where the numerator represents the covariance of the X and Y variables, given by
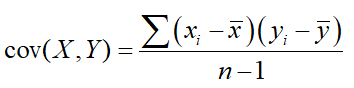
Recall that intuitively, the covariance of two variables is the measure of the joint variability of the two variables. In general, if X and Y are both above and below average together, then the covariance (and by extension the correlation) is positive. Inversely, if X tends to be above average when Y tends to be below, and vice versa, the covariance is negative. Finally, though, if X and Y are perfectly uncorrelated (i.e, independent), then their covariance is 0, since necessarily there is no consistency to when each variable is above and/or below average, and so these quantities will cancel.
So by that argument, |r| > 0. To show that |r| < 1, we must use something called the Cauchy-Schwarz Inequality. This inequality shows that, in essence, the square of the sum of a series of products is necessarily less than or equal to the product of the sums of the squares of the numbers being multiplied. In symbols:

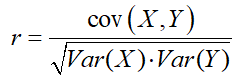
Consider again formula 1 above. The standard deviation of a variable is the square root of its variance, so another way of writing formula 1 would be:
By Cauchy-Schwarz: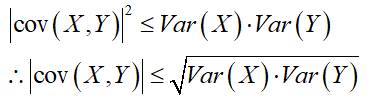
And therefore:

Hence, 0 < |r| < 1, meaning r is necessarily bound between 1 and -1.
Finally, recall that our originally calculated equation for the line of best fit for data, based on the z-scores of our data, was ẑy = r*zx (the proof for this is in the textbook on page 180!). If the relationship between x and y is perfectly linear, then every residual of y – ŷ equals zero, which by extension means that every zy – ẑy is equal to zero, meaning zy = ẑy, meaning |r| = 1. As the greater quantity of residuals increases (see the Mean Squared Residual, or MSR in the proof in the book), the less perfect the relationship between zy and ẑy becomes, and |r| gets farther from 1. Therefore, we use r close to 1 or -1 to represent a strong relationship and r close to 0 to represent a weak one.
